CORRECTION – Allegro MicroSystems Announces Results for the Second Fiscal Quarter Ended September 25, 2020
--Strong Growth and Solid Operating Results--
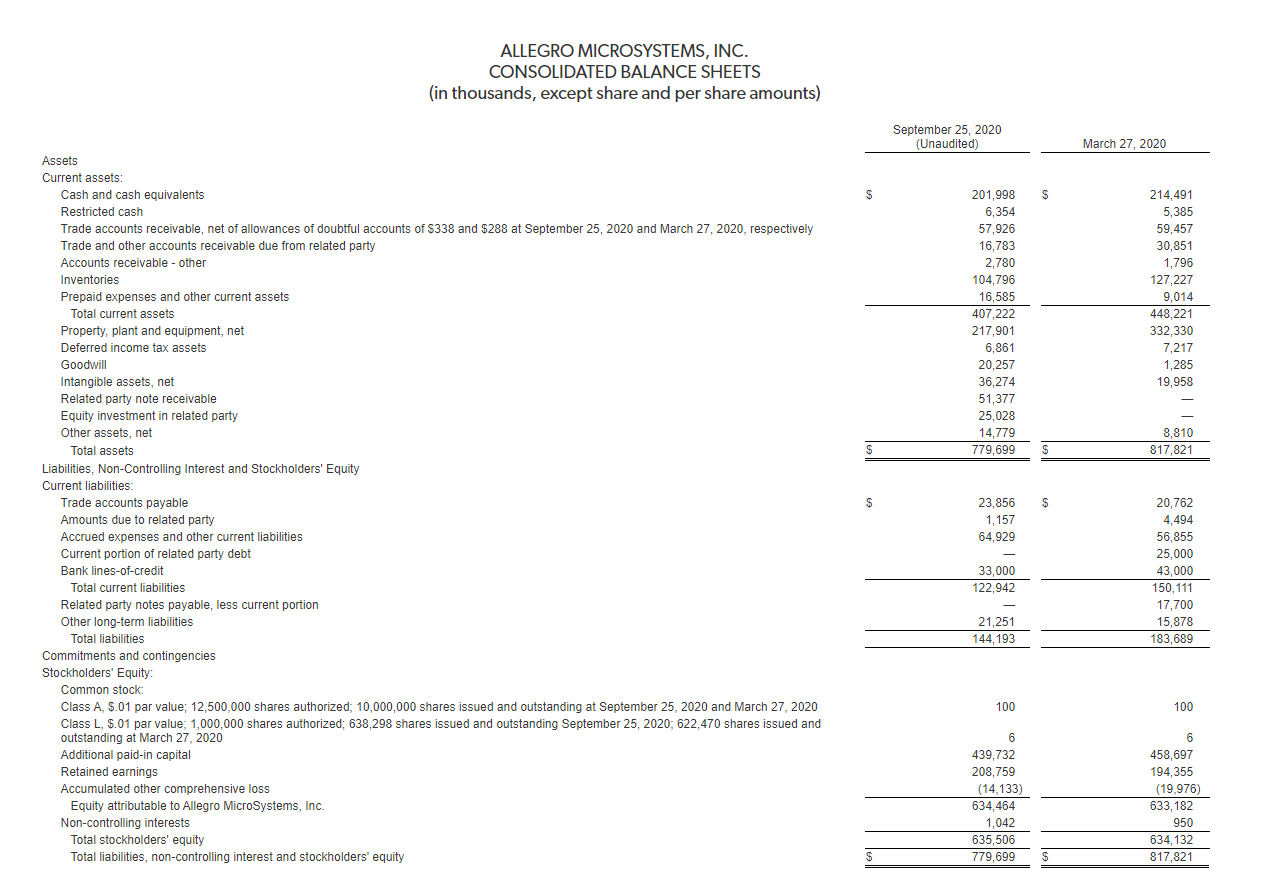
MANCHESTER, N.H., Nov. 19, 2020 (GLOBE NEWSWIRE) -- In a release issued under the same headline earlier today by Allegro MicroSystems, Inc. (Nasdaq:ALGM), please note that the balance sheet line items for Total current liabilities, Related party notes payable, less current portion, Other long-term liabilities and Total liabilities reported incorrect amounts for both the current and prior period. The corrected release follows:
Allegro MicroSystems, Inc. (“Allegro” or the “Company”) (Nasdaq:ALGM), a global leader in power and sensing semiconductor solutions for motion control and energy efficient systems, today announced financial results for its second fiscal quarter ended September 25, 2020. Total net sales for the three-month period ended September 25, 2020 were $136.6 million, an increase of 18.8% from the prior quarter, demonstrating strong revenue recovery.
“Our business turned a corner in the second fiscal quarter, rebounding off the lows related to the pandemic and showing a quick recovery in our key markets in automotive and industrial where we believe we continue to gain market share,” said Ravi Vig, President and CEO of Allegro MicroSystems. “While uncertainty remains, we have our eye on our long-term opportunities and believe we are in the sweet spot of the convergence of growth trends in automotive, Industry 4.0, data center and green energy, positioning us to take full advantage of a market recovery.”
Business Summary
Automotive revenue was up 17.2% sequentially during the second quarter driven by global auto production growth and also strength in the Company's xEV business, which nearly doubled from the three-month period ended September 27, 2019. During the second fiscal quarter, the Company completed its strategic acquisition of Voxtel, a privately held company specializing in advanced photonics and 3D imaging technology including components for long-range, eye-safe Light Detection and Ranging (LiDAR). This acquisition brings together Voxtel’s laser and imaging expertise with Allegro’s automotive leadership and scale to enable what the Company believes will be the next generation of Advanced Driver Assistance Systems (ADAS).
Industrial revenue in the second quarter was up 19.7% year-over-year compared to the same prior year fiscal period and 6.1% sequentially due to continued strength in demand for the Company’s three-phase drivers in data centers. The Company’s “Other” business, which represents non-strategic markets, including white goods, desktop computing, printers and peripherals, benefited in part from COVID-related demand for these products.
Business Outlook
For the third fiscal quarter ending December 25, 2020, the Company expects total net sales to be in the range of $147 million to $151 million, with both the Automotive and Industrial businesses growing from the second fiscal quarter. Non-GAAP gross margin is expected to be in the range of 50% - 51%, and non-GAAP earnings per fully-diluted share for the same period is expected to be in the range of $0.11 to $0.12. This guidance is based on an estimated approximate 189.4 million fully-diluted shares outstanding.
Allegro has not provided a reconciliation of its third fiscal quarter outlook for non-GAAP gross margin and non-GAAP earning per fully-diluted share because estimates of all of the reconciling items cannot be provided without unreasonable efforts. It is difficult to reasonably provide a forward-looking estimate between such forward-looking non-GAAP measures and the comparable forward-looking GAAP measures. Certain factors that are materially significant to Allegro’s ability to estimate these items are out of its control and/or cannot be reasonably predicted, including with respect to transaction fees, stock compensation charges, facility closing and consolidation costs, deferred financing costs associated with the repayment of at least 75% of the Company's $325 million term loan, a pre-IPO $400 million dividend; and the tax consequences of each of these events.
Earnings Webcast
A webcast will be held on Thursday, November 19, at 8:30 a.m. Eastern time. Ravi Vig, Chief Executive Officer and Paul Walsh, Chief Financial Officer, will discuss Allegro’s financial results.
The webcast will be available on the Investor Relations section of the Company’s website at investors.allegromicro.com. A recording of the webcast will be posted in the same location and will be available shortly after the call concludes and will be available for at least 30 days.
About Allegro MicroSystems
Allegro MicroSystems is a leading global designer, developer, fabless manufacturer and marketer of sensor integrated circuits (“ICs”) and application-specific analog power ICs enabling emerging technologies in the automotive and industrial markets. Allegro’s diverse product portfolio provides efficient and reliable solutions for the electrification of vehicles, automotive ADAS safety features, automation for Industry 4.0 and power saving technologies for data centers and green energy applications.
Forward-Looking Statements
This press release contains forward-looking statements within the meaning of the Private Securities Litigation Reform Act of 1995. All statements contained in this press release that do not relate to matters of historical fact should be considered forward-looking statements, including, without limitation, statements regarding the expected benefits resulting from our acquisition of Voxtel and our expected financial performance for our third fiscal quarter ending December 25, 2020. In some cases, you can identify forward-looking statements by terms such as “anticipate,” “believe,” “could,” “expect,” “should,” “plan,” “intend,” “estimate,” “target,” “mission,” “may,” “will,” “would,” “should,” “could,” “target,” “potential,” “project,” “predict,” “contemplate,” “potential,” or the negative thereof and similar words and expressions.
Forward-looking statements are based on management’s current expectations, beliefs and assumptions and on information currently available to us. Such statements are subject to a number of known and unknown risks, uncertainties and assumptions, and actual results may differ materially from those expressed or implied in the forward-looking statements due to various important factors, including, but not limited to: downturns or volatility in general economic conditions, including as a result of the COVID-19 pandemic, particularly in the automotive market; our ability to compete effectively with intense competition, expand our market share and increase our profitability; our ability to compensate for decreases in average selling prices of our products; the cyclical nature of the analog semiconductor industry; our ability to manage any sustained yield problems or other delays at our third-party wafer fabrication facilities or in the final assembly and test of our products; our ability to fully realize the benefits of past and potential future initiatives designed to improve our competitiveness, growth and profitability; our ability to accurately predict our quarterly net sales and operating results; our ability to adjust our supply chain volume to account for changing market conditions and customer demand; our dependence on manufacturing operations in the Philippines; changes in government trade policies, including the imposition of tariffs and export restrictions; and our ability to protect our proprietary technology and inventions through patents or trade secrets; and other important factors discussed under the caption “Risk Factors” in our final prospectus on Form 424(b) filed with the U.S. Securities and Exchange Commission (“SEC”) on October 30, 2020, as any such factors may be updated from time to time in our other filings with the SEC, which are accessible on the SEC’s website at www.sec.gov and the Investors & Media page of our website at investors.allegromicro.com.
All forward-looking statements speak only as of the date of this press release and, except as required by applicable law, we do not plan to publicly update or revise any forward-looking statements contained herein, whether as a result of any new information, future events, changed circumstances or otherwise.
ALLEGRO MICROSYSTEMS, INC.
Consolidated Statements of Income
(in thousands, except share and per share amounts)
(Unaudited)
| Three-Month Period Ended | Six-Month Period Ended | |||||||||||||||
2020 |
2019 |
2020 |
2019 |
|||||||||||||
| Net sales | $ | 114,138 | $ | 146,615 | $ | 205,519 | $ | 282,891 | ||||||||
| Net sales to related party | 22,511 | 16,625 | 46,131 | 32,792 | ||||||||||||
| Total net sales | 136,649 | 163,240 | 251,650 | 315,683 | ||||||||||||
| Cost of goods sold | 74,879 | 94,634 | 134,179 | 187,690 | ||||||||||||
| Gross profit | 61,770 | 68,606 | 117,471 | 127,993 | ||||||||||||
| Operating expenses: | ||||||||||||||||
| Research and development | 25,130 | 25,952 | 49,510 | 52,080 | ||||||||||||
| Selling, general and administrative | 24,238 | 27,593 | 51,027 | 53,121 | ||||||||||||
| Total operating expenses | 49,368 | 53,545 | 100,537 | 105,201 | ||||||||||||
| Operating income | 12,402 | 15,061 | 16,934 | 22,792 | ||||||||||||
| Other income (expense): | ||||||||||||||||
| Interest income (expense), net | 350 | (65 | ) | 663 | (70 | ) | ||||||||||
| Foreign currency transaction (loss) gain | (1,318 | ) | 609 | (1,186 | ) | 3,360 | ||||||||||
| Income in earnings of equity investment | 246 | — | 458 | — | ||||||||||||
| Other, net | 20 | (1,189 | ) | 213 | (1,096 | ) | ||||||||||
| Income before income taxes | 11,700 | 14,416 | 17,082 | 24,986 | ||||||||||||
| Income tax provision | 2,082 | 2,833 | 2,610 | 10,168 | ||||||||||||
| Net income | 9,618 | 11,583 | 14,472 | 14,818 | ||||||||||||
| Net income attributable to non-controlling interests | 34 | 18 | 68 | 69 | ||||||||||||
| Net income attributable to |
$ | 9,584 | $ | 11,565 | $ | 14,404 | $ | 14,749 | ||||||||
| Net income attributable to |
||||||||||||||||
| Basic and diluted | $ | 0.96 | $ | 1.16 | $ | 1.44 | $ | 1.47 | ||||||||
| Weighted average shares outstanding: | ||||||||||||||||
| Basic and diluted | 10,000,000 | 10,000,000 | 10,000,000 | 10,000,000 | ||||||||||||
Supplemental Schedule of Total Net Sales
The following table summarizes net sales by core end market and other applications. Other applications include sales of wafer foundry products and from the distribution of Sanken products unrelated to and no longer part of the Company’s business in fiscal year 2021.
| Three-Month Period Ended | Change | Six-Month Period Ended | Change | |||||||||||||||||||||||||||
2020 |
2019 |
Amount | % | 2020 |
2019 |
Amount | % | |||||||||||||||||||||||
| (Dollars in thousands) | ||||||||||||||||||||||||||||||
| Core end markets: | ||||||||||||||||||||||||||||||
| Automotive | $ | 89,479 | $ | 98,209 | $ | (8,730 | ) | (8.9 | )% | $ | 165,857 | $ | 190,607 | $ | (24,750 | ) | (13.0 | )% | ||||||||||||
| Industrial | 21,650 | 18,092 | 3,558 | 19.7 | % | 42,056 | 34,737 | 7,319 | 21.1 | % | ||||||||||||||||||||
| Other | 25,520 | 20,542 | 4,978 | 24.2 | % | 43,737 | 38,329 | 5,408 | 14.1 | % | ||||||||||||||||||||
| Total core end markets | 136,649 | 136,843 | (194 | ) | (0.1 | )% | 251,650 | 263,673 | (12,023 | ) | (4.6 | )% | ||||||||||||||||||
| Other applications: | ||||||||||||||||||||||||||||||
| Wafer foundry products | — | 16,698 | (16,698 | ) | (100.0 | )% | — | 32,988 | (32,988 | ) | (100.0 | )% | ||||||||||||||||||
| Distribution of Sanken products | — | 9,699 | (9,699 | ) | (100.0 | )% | — | 19,022 | (19,022 | ) | (100.0 | )% | ||||||||||||||||||
| Total net sales | $ | 136,649 | $ | 163,240 | $ | (26,591 | ) | (16.3 | )% | $ | 251,650 | $ | 315,683 | $ | (64,033 | ) | (20.3 | )% |
||||||||||||
Supplemental Schedule of Stock-Based Compensation
The Company recorded stock-based compensation expense in the following expense categories of its unaudited consolidated statements of income:
| Three-Month Period Ended | Six-Month Period Ended | |||||||||||||||
| (In thousands) | 2020 |
2019 |
2020 |
2019 |
||||||||||||
| Cost of sales | $ | 53 | $ | 45 | $ | 150 | $ | 90 | ||||||||
| Research and development | 32 | 26 | 53 | 45 | ||||||||||||
| Selling, general and administrative | 495 | 303 | 822 | 613 | ||||||||||||
| Total stock-based compensation | $ | 580 | $ | 374 | $ | 1,025 | $ | 748 | ||||||||
Consolidated Statements of Income
(in thousands, except share and per share amounts)
(Unaudited)
| Three-Month Period Ended | Six-Month Period Ended | ||||||||||||||
2020 |
2019 |
2020 |
2019 |
||||||||||||
| Net sales | $ | 114,138 | $ | 146,615 | $ | 205,519 | $ | 282,891 | |||||||
| Net sales to related party | 22,511 | 16,625 | 46,131 | 32,792 | |||||||||||
| Total net sales | 136,649 | 163,240 | 251,650 | 315,683 | |||||||||||
| Cost of goods sold | 74,879 | 94,634 | 134,179 | 187,690 | |||||||||||
| Gross profit | 61,770 | 68,606 | 117,471 | 127,993 | |||||||||||
| Operating expenses: | |||||||||||||||
| Research and development | 25,130 | 25,952 | 49,510 | 52,080 | |||||||||||
| Selling, general and administrative | 24,238 | 27,593 | 51,027 | 53,121 | |||||||||||
| Total operating expenses | 49,368 | 53,545 | 100,537 | 105,201 | |||||||||||
| Operating income | 12,402 | 15,061 | 16,934 | 22,792 | |||||||||||
| Other income (expense): | |||||||||||||||
| Interest income (expense), net | 350 | (65 | ) | 663 | (70 | ) | |||||||||
| Foreign currency transaction (loss) gain | (1,318) | 609 | (1,186 | ) | 3,360 | ||||||||||
| Income in earnings of equity investment | 246 | — | 458 | — | |||||||||||
| Other, net | 20 | (1,189 | ) | 213 | (1,096 | ) | |||||||||
| Income before income taxes | 11,700 | 14,416 | 17,082 | 24,986 | |||||||||||
| Income tax provision | 2,082 | 2,833 | 2,610 | 10,168 | |||||||||||
| Net income | 9,618 | 11,583 | 14,472 | 14,818 | |||||||||||
| Net income attributable to non-controlling interests | 34 | 18 | 68 | 69 | |||||||||||
| Net income attributable to |
$ | 9,584 | $ | 11,565 | $ | 14,404 | $ | 14,749 | |||||||
| Net income attributable to |
|||||||||||||||
| Basic and diluted | $ | 0.96 | $ | 1.16 | $ | 1.44 | $ | 1.47 | |||||||
| Weighted average shares outstanding: | |||||||||||||||
| Basic and diluted | 10,000,000 | 10,000,000 | 10,000,000 | 10,000,000 | |||||||||||
Supplemental Schedule of Total